FinanceDataReader([1]) 라이브러리를 사용하면 다양한 주식 혹은 index 등에 대한 일봉 데이터를 가져오기 쉽습니다. 하지만 투자를 할 때 주봉, 월봉도 고려하고 싶어 집니다. 이를 위해 python을 사용해 일봉 데이터를 변환하는 방법을 알아보겠습니다.
주가 데이터는 보통 dataframe 으로 나타내고, python에는 이를 처리하기 위한 pandas라는 강력한 툴이 있습니다. 이 pandas에는 resample([2])이라는 강력한 method도 있습니다. 이 method 에는 'rule'이라는 변수를 넣어야 하는데, 데이터를 resample 할 기준에 대한 값으로, 'Y', 'M', 'W', 'D', 'H', 'T'(min) 등이 들어갈 수 있습니다. 예를 들어 'W'로 값을 넣으면 데이터를 주별로 resample 해주는 것입니다!
이런 강력한 method로 손쉽게 데이터를 변환할 수 있는데 주의해야 할 점이 있습니다. 데이터가 datetime-like index를 가지거나 column 중에 하나가 datetime-like이고 method의 변수 'on'에 해당 column의 이름을 넣어줘야 한다는 점입니다. FinanceDataReader로 데이터를 읽어오는 경우는 index가 datetime으로 되어 있으니 그대로 넣어주시면 됩니다.
실제 코드 예시는 다음과 같습니다.
import pandas as pd
import FinanceDataReader as fdr

def get_week_month_df(df, period='W'):
    wm_df = pd.DataFrame()
    wm_df = pd.concat([wm_df, df[['Open']].resample(period).first()], axis=1)
    wm_df = pd.concat([wm_df, df[['High']].resample(period).max()], axis=1)
    wm_df = pd.concat([wm_df, df[['Low']].resample(period).min()], axis=1)
    wm_df = pd.concat([wm_df, df[['Close']].resample(period).last()], axis=1)
    wm_df = pd.concat([wm_df, df[['Volume']].resample(period).mean()], axis=1)
    return wm_df

# KOSPI Index 코스피 지수 데이터
kospi_df = fdr.DataReader('KS11')
week_kospi_df = get_week_month_df(df, period='W')
month_kospi_df = get_week_month_df(df, period='M')
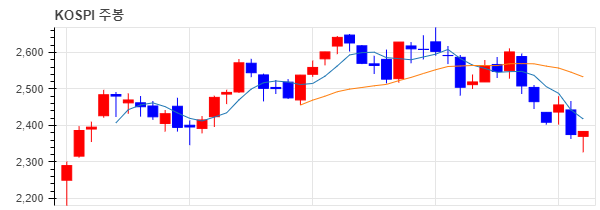
추가로 FinanceDataReader 를 사용하면 손쉽게 아래와 같이 일봉, 주봉 등의 그래프를 그려볼 수도 있습니다.

위의 그래프 작성 코드는 다음과 같습니다.
import pandas as pd
import FinanceDataReader as fdr


df = fdr.DataReader('KS11', '2023-01-01', '2023-10-25')  # 일부

# 차트 설정
config = {'title': 'KOSPI 일봉',
          'width': 600,
          'height': 300,
          'volume': True,
          }

fdr.chart.config(config=config)
fdr.chart.plot(df)


def get_week_month_df(df, period='W'):
    wm_df = pd.DataFrame()
    wm_df = pd.concat([wm_df, df[['Open']].resample(period).first()], axis=1)
    wm_df = pd.concat([wm_df, df[['High']].resample(period).max()], axis=1)
    wm_df = pd.concat([wm_df, df[['Low']].resample(period).min()], axis=1)
    wm_df = pd.concat([wm_df, df[['Close']].resample(period).last()], axis=1)
    wm_df = pd.concat([wm_df, df[['Volume']].resample(period).mean()], axis=1)
    return wm_df


# 차트 설정
config = {'title': 'KOSPI 주봉',
          'width': 600,
          'height': 300,
          'volume': True,
          }

week_df = get_week_month_df(df)
fdr.chart.config(config=config)
fdr.chart.plot(week_df)
Reference
[1] https://github.com/FinanceData/FinanceDataReader
GitHub - FinanceData/FinanceDataReader: Financial data reader
Financial data reader. Contribute to FinanceData/FinanceDataReader development by creating an account on GitHub.
github.com
[2] https://pandas.pydata.org/docs/reference/api/pandas.DataFrame.resample.html
pandas.DataFrame.resample — pandas 2.1.2 documentation
The timestamp on which to adjust the grouping. The timezone of origin must match the timezone of the index. If string, must be one of the following: Note Only takes effect for Tick-frequencies (i.e. fixed frequencies like days, hours, and minutes, rather t
pandas.pydata.org
'퀀트투자' 카테고리의 다른 글
| 한국투자증권 OpenAPI 사용하기(2) - KIS Developers (2) | 2024.02.25 |
|---|---|
| 한국투자증권 OpenAPI 사용하기(1) - mojito (4) | 2023.11.04 |
| 대신증권 API로 데이터 가져오기 (분봉, 일봉) with python (0) | 2023.10.28 |